

About
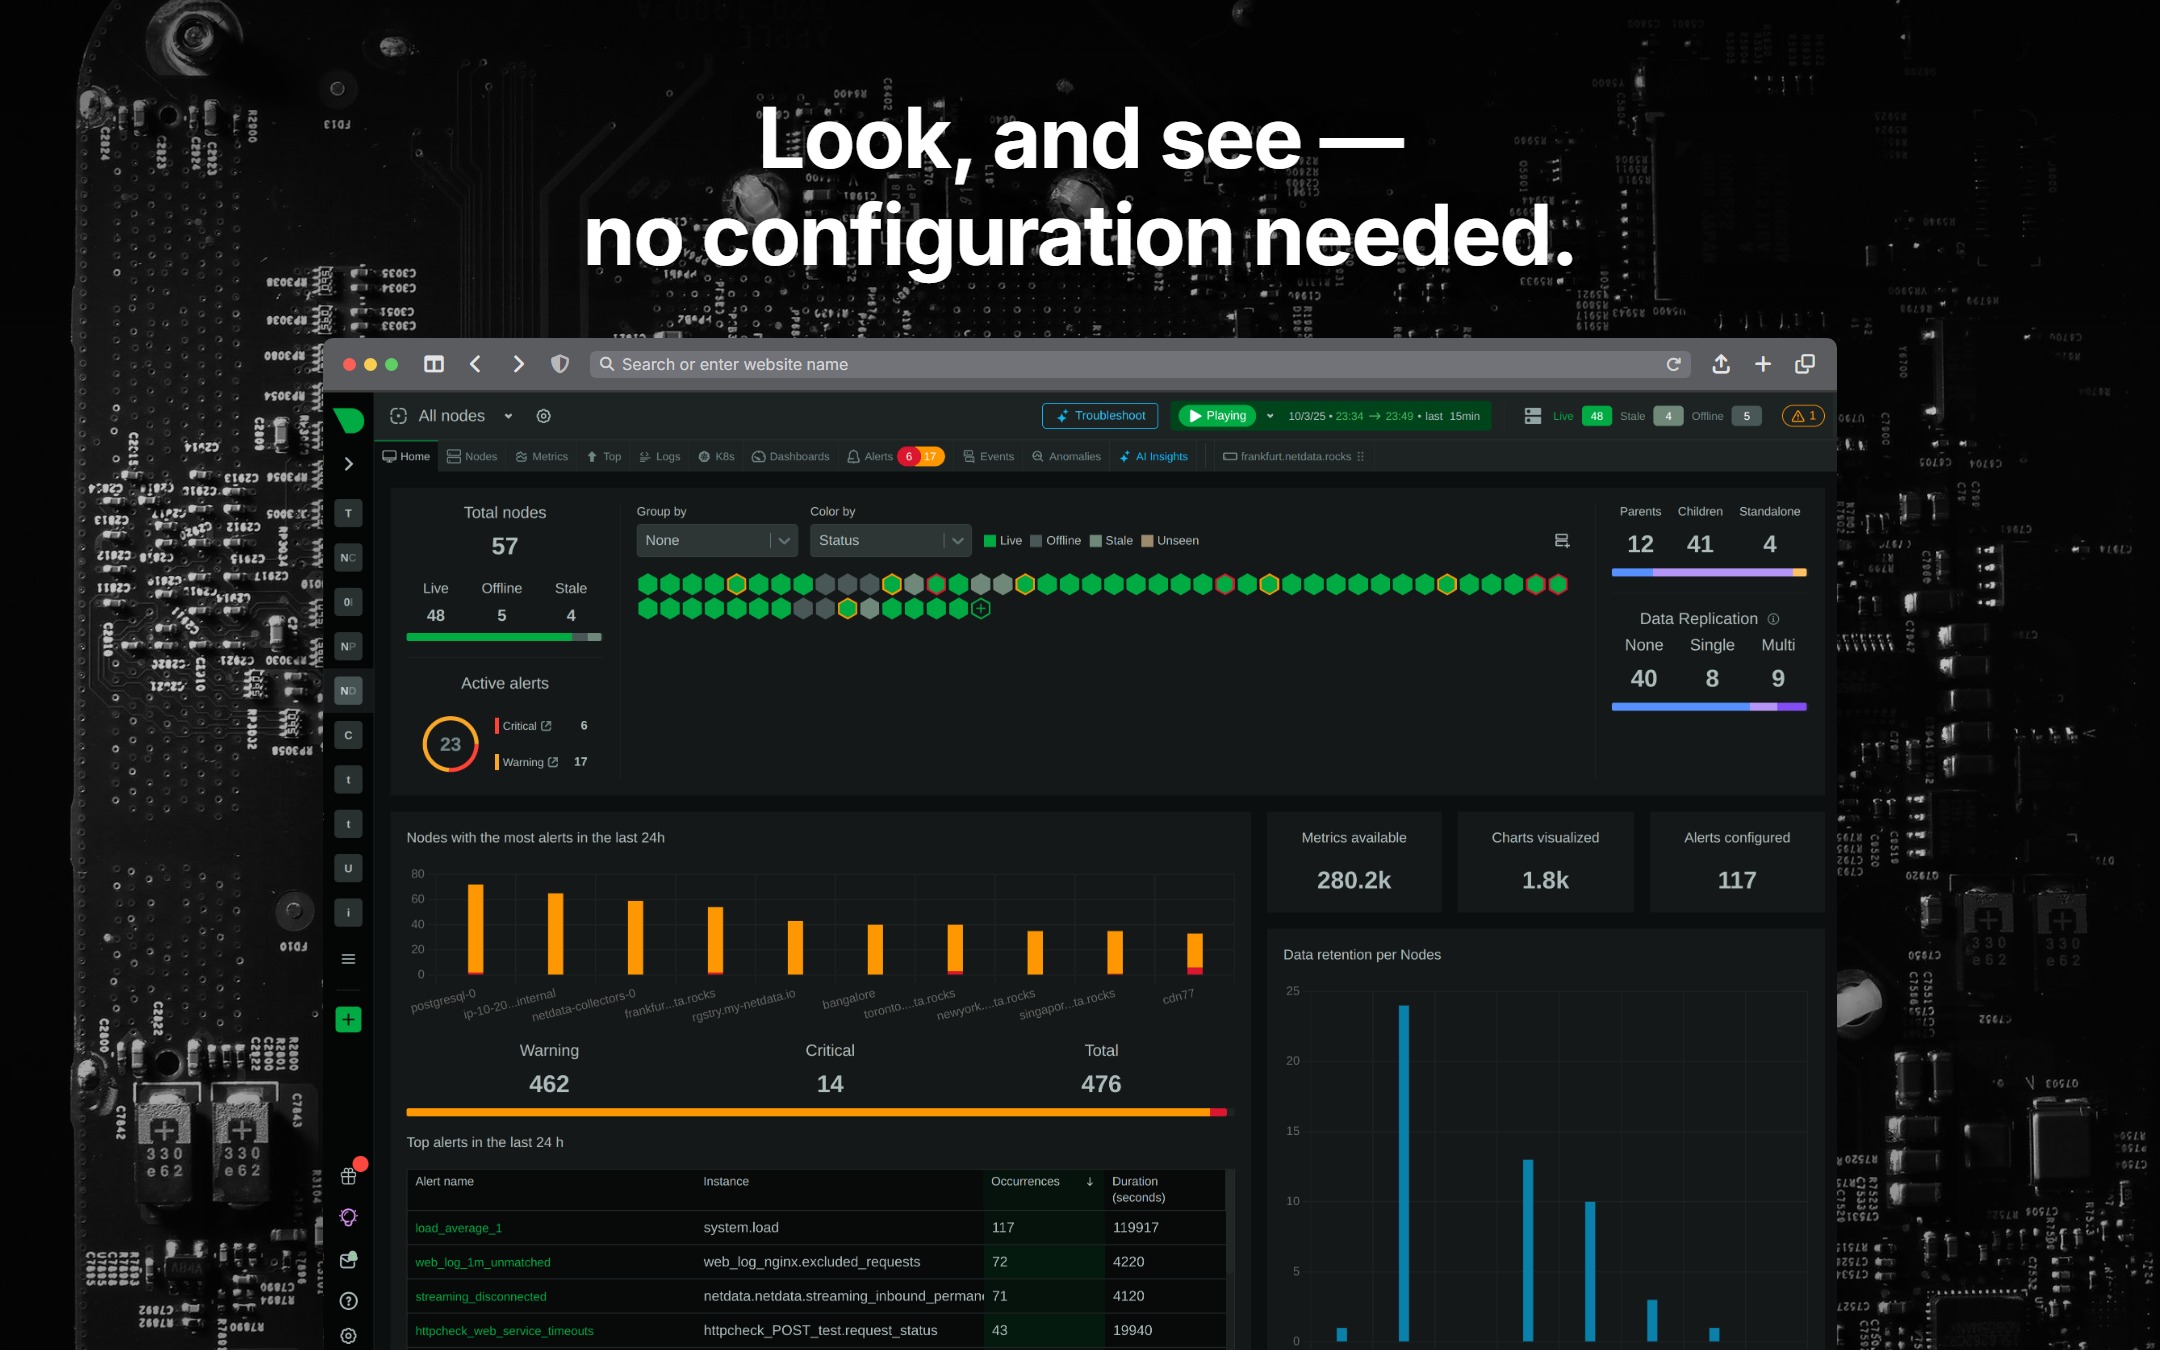
Netdata is a real-time monitoring dashboard for the machine your node runs on. It collects thousands of metrics every second and charts them live, so instead of wondering whether your device is healthy you can simply look and see. It needs no configuration to be useful — it discovers what is running and starts graphing it.
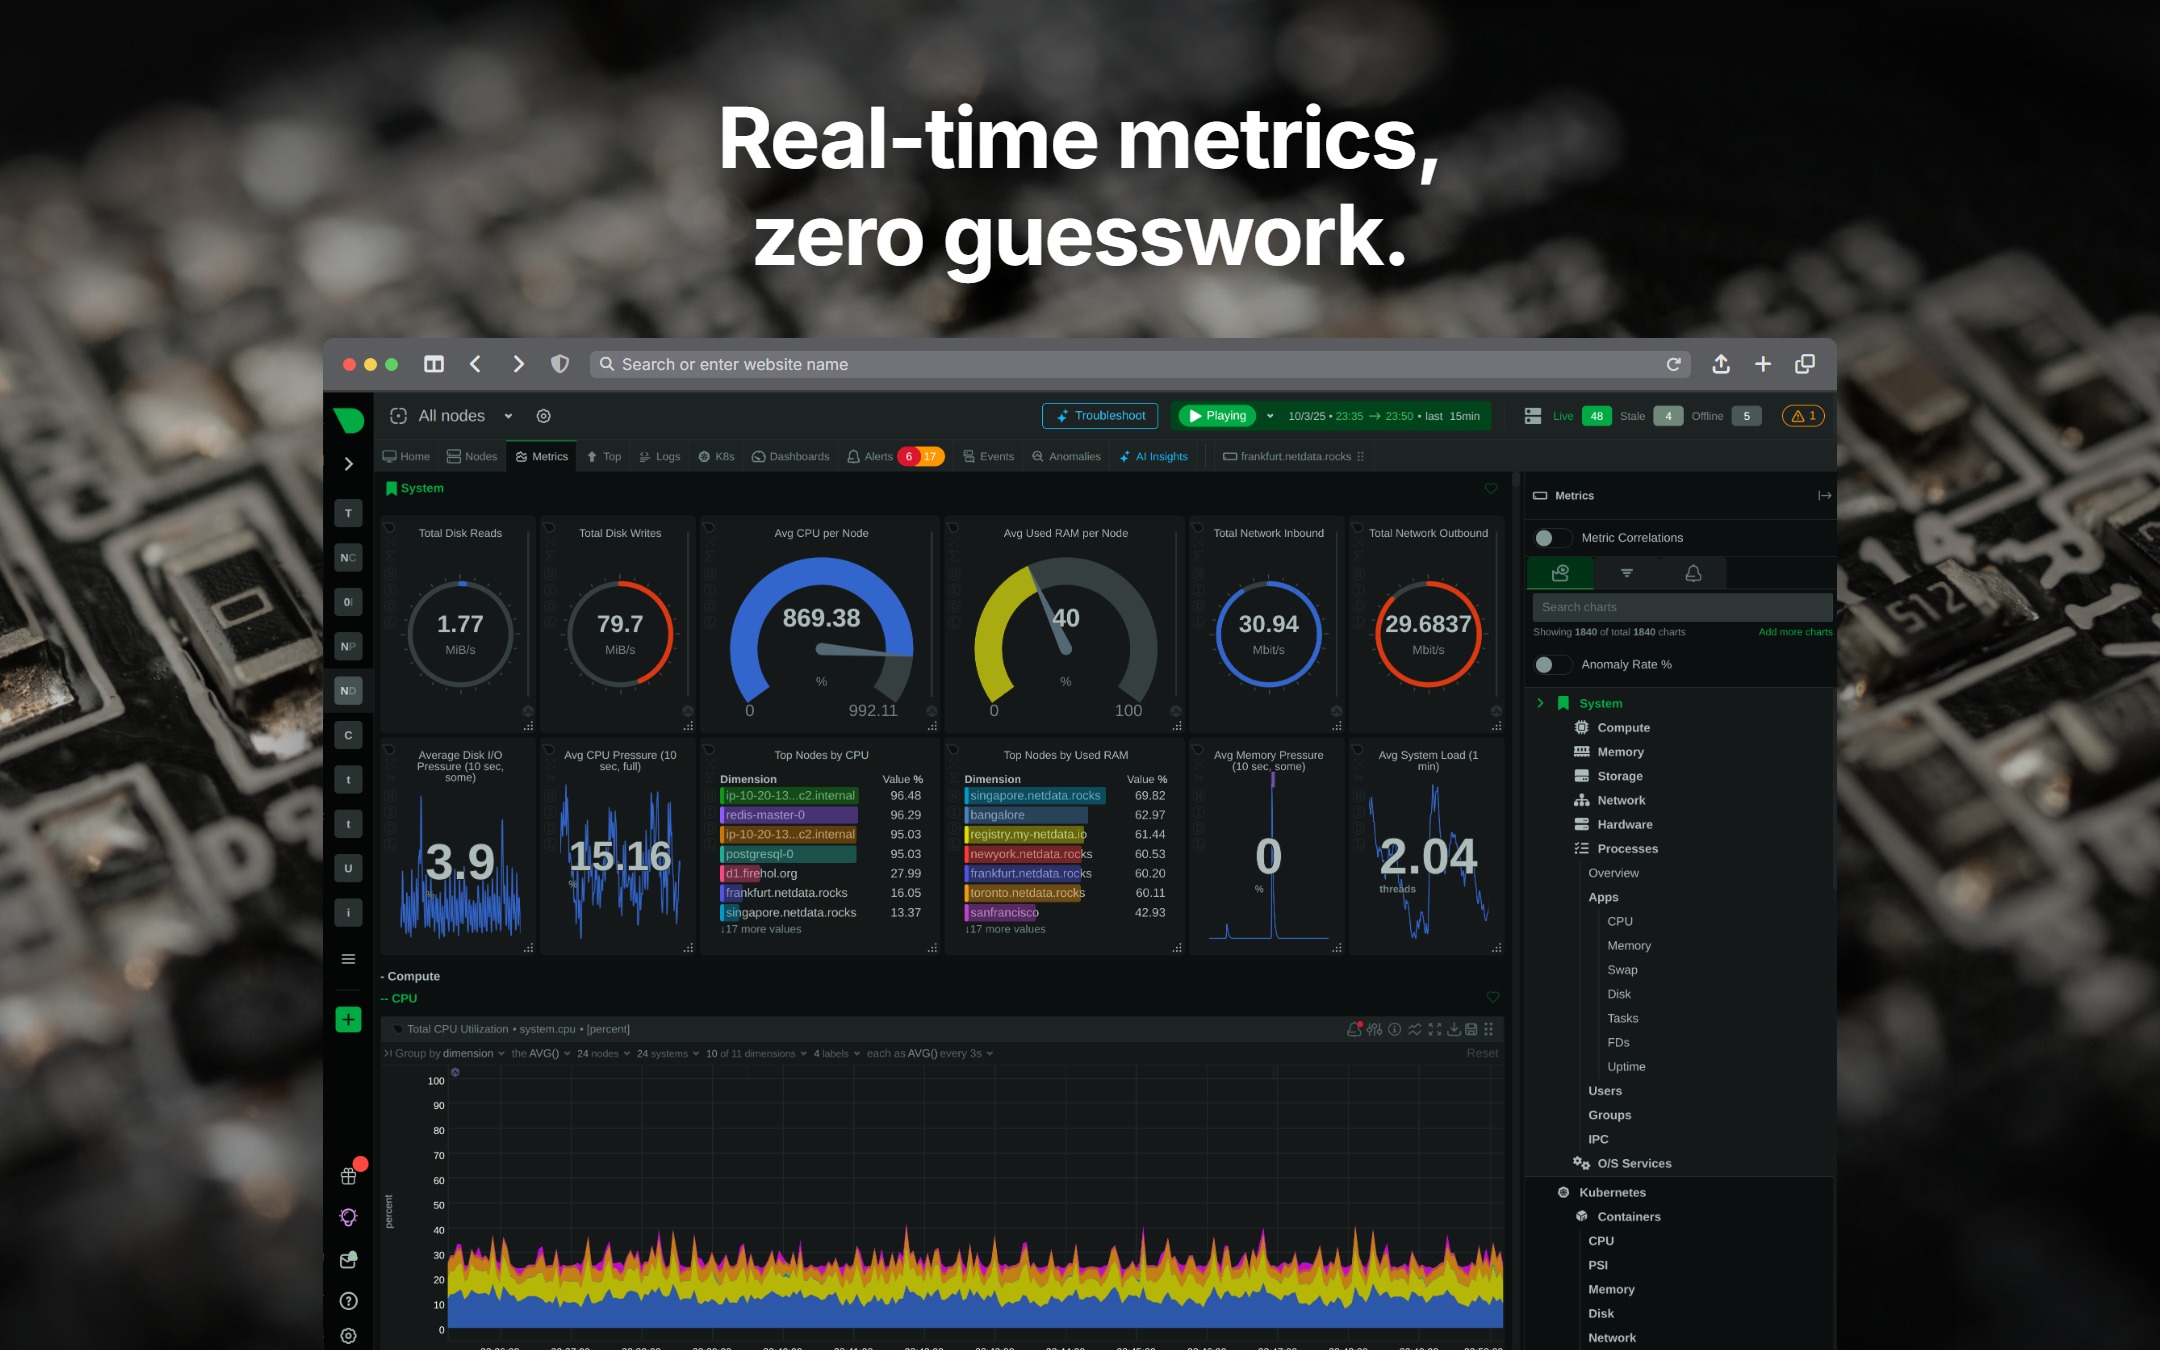
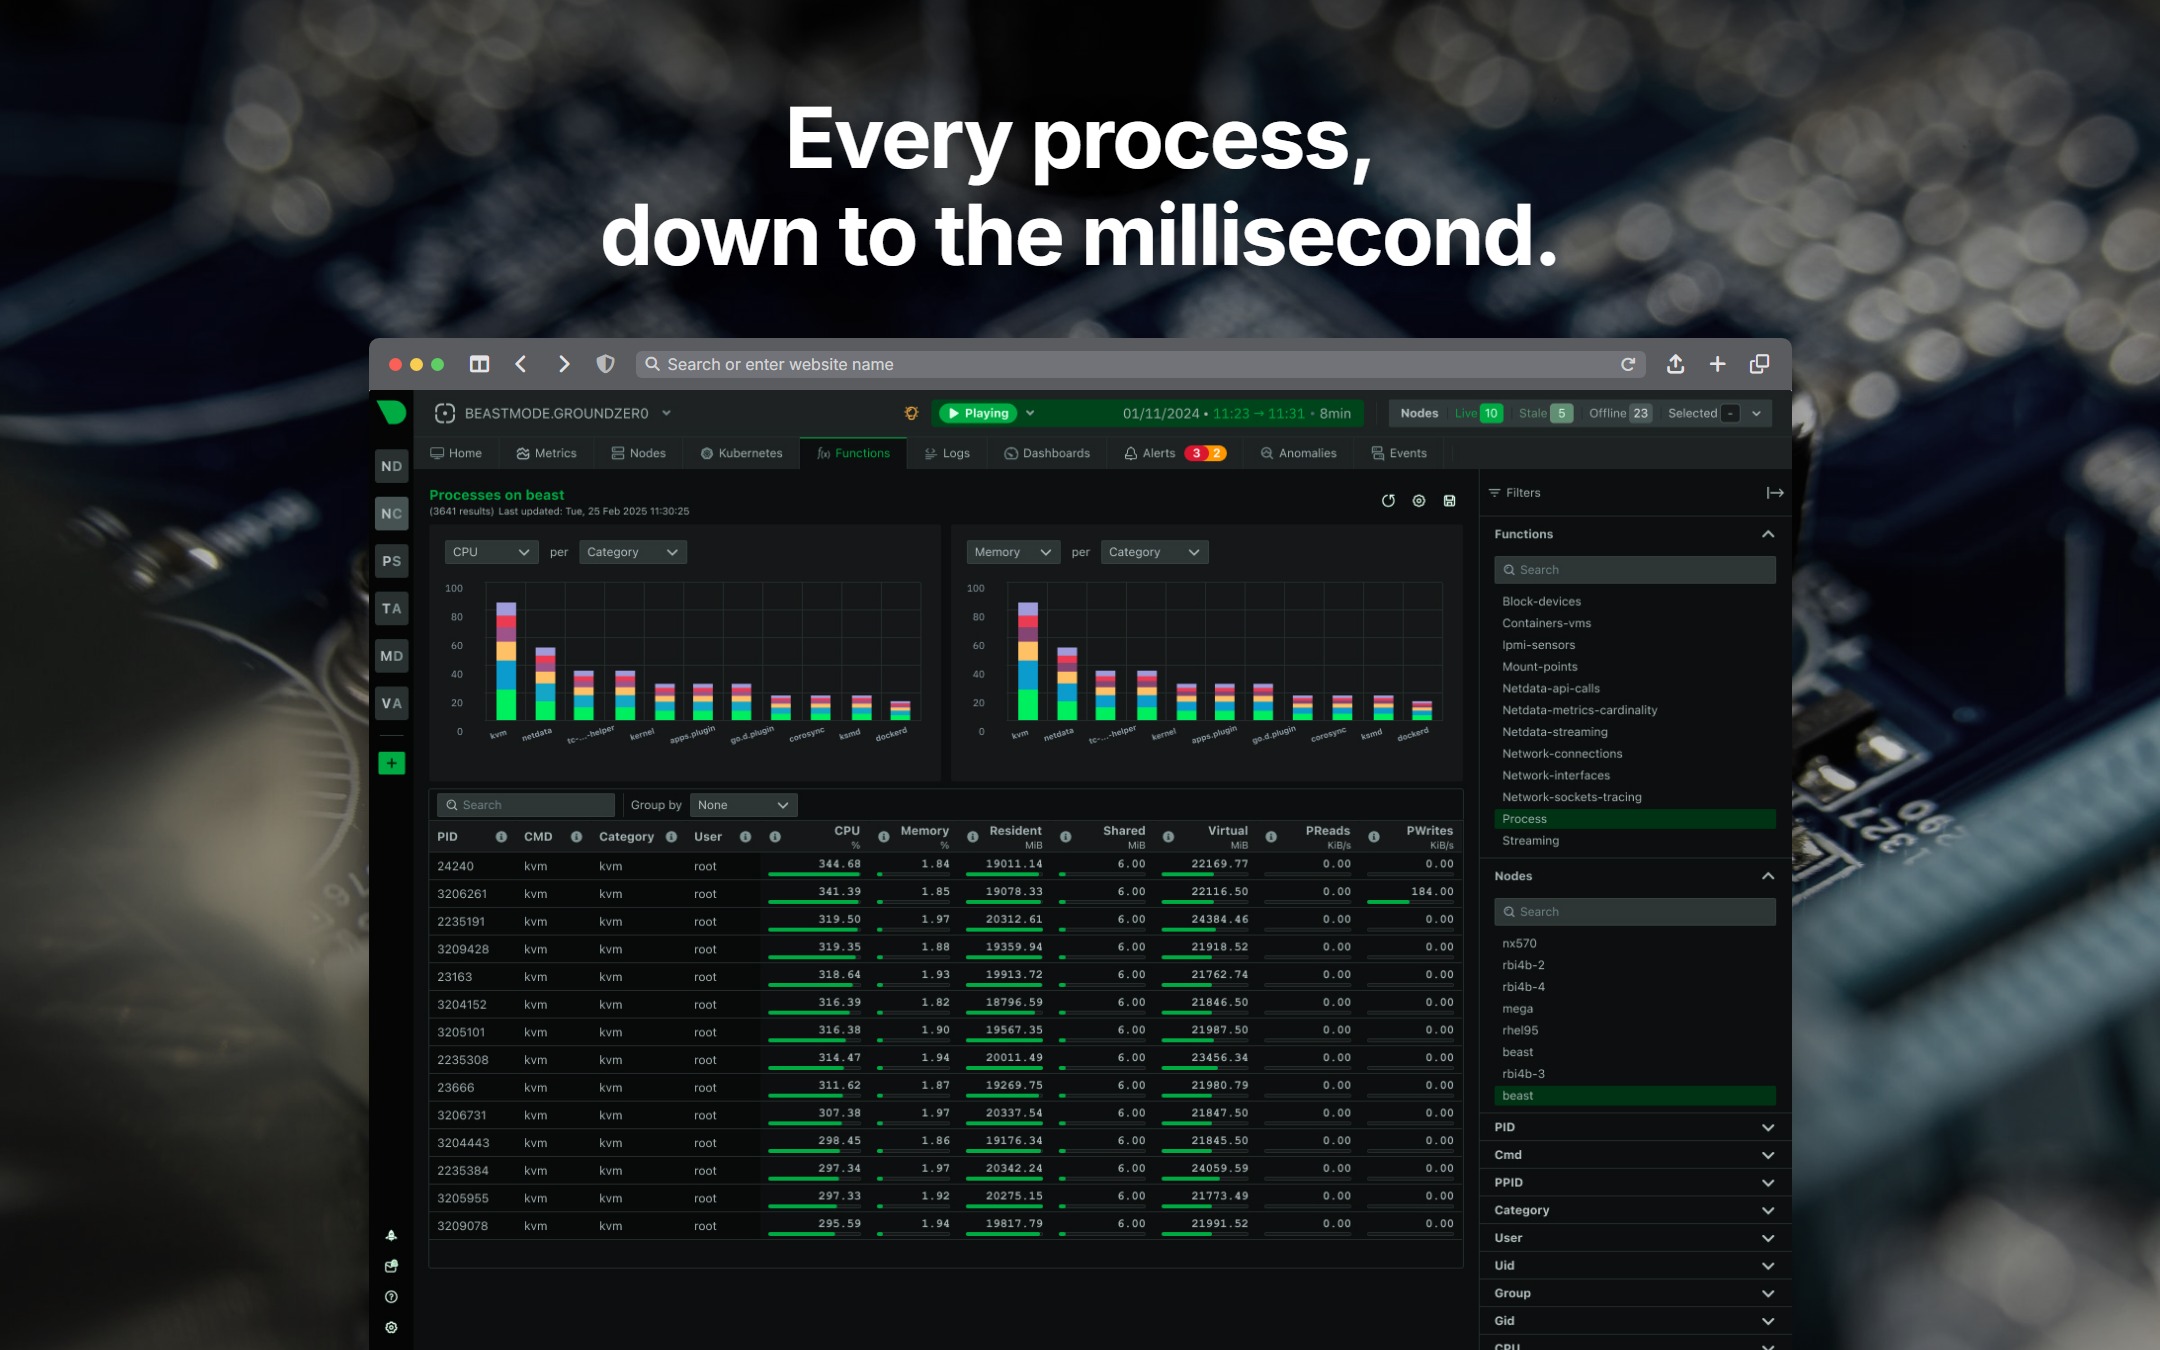
The metrics cover the whole system: CPU load and temperature, memory and swap use, disk activity and free space, filesystem health, network interfaces and bandwidth, running processes, and hardware sensors including fan speeds and S.M.A.R.T. drive data. Every chart is interactive, so you can zoom into any window of time and correlate what happened across all of them at once.
It is genuinely real-time, at one-second resolution rather than the one- or five-minute averages most monitoring tools settle for. That resolution is what makes a brief spike visible at all — a momentary CPU stall or a disk that hesitated under load shows up here and gets averaged out of existence elsewhere. Alarms come preconfigured for the conditions that usually matter, and history is stored efficiently enough to keep a long record on modest hardware.
On a MyNode this is the tool for answering hardware questions. Is the drive filling up as the blockchain grows? Is the device running hot or throttling? Did initial block download saturate the network link, or is something else the bottleneck? Because the Agent runs locally and stores its data on the device, no metrics are shipped anywhere unless you choose to connect it to Netdata Cloud.
Netdata is open source and widely used far beyond Bitcoin nodes, from single servers to large clusters. Here it serves a narrower, practical purpose: knowing your node's hardware is holding up, and catching trouble early when it is not.



Get Started
Run Netdata on your own node
Get a MyNode device or install the software on your own hardware to start using Netdata and dozens of other apps.